
Aside from being the closest planet to the Sun, Mercury is only second to distant Pluto in being the smallest planet of
our solar system. It rotates completely around the Sun once every 88 days and has such a slow rotation about its axis
that a day on Mercury is greater in length than its year (ie. time required to orbit the Sun). The proximity of Mercury
to the Sun is responsible for its characteristic surface which is completely covered with craters, for the immense
gravitational force of the Sun attracts many comets and asteroids which inevitably also crash into Mercury due its close
proximity to the Sun. At aphelion, Mercury reaches a temperature of 285ーC whereas during perihelion it surpasses 430ーC
(7.5x the greatest temperature ever recorded on the surface of the Earth: 57.7ーC, Lybia, Sept 1922). In contrast, the
temperature at night reaches -180ーC due to the absence of any atmosphere. The only satellite mission to Mercury was
Mariner 10 which made three fly-bys between March 1974 and March 1975 when it photographed half its surface. One of the
most dominant features encountered by Mariner 10 is a plateau measuring 1300 km in diameter and is most probably due to
an impact from a 100-km wide asteroid travelling at 500,000 km per hour.
2003 Transit:
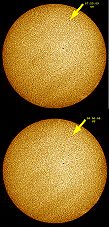
I was most fortunate on May 7th, 2003 to be perfectly located for the Mercury transit against the sun. This event is
relatively rare as it occurs, on average, about thirteen times each century. The transiting Mercury had an apparent
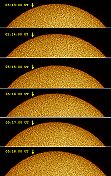
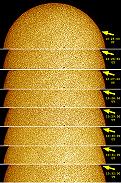
diameter of only 12.0 arc-seconds or approximately 1/160th that of the sun. Table 1 below describes the various key
stages of the transit (UT+3) whereas Table 2 provides a visual representation of these same events as well as a sequence
of the complete 5-hr and 20-minute transit. Complete ingress, maximum and egress are based on integrations 60 seconds
apart whereas the complete transit is based on 33 integrations spaced at ten-minute intervals and (very painfully)
digitally processed and assembled. Clicking on any of the images below will permit for the assessment of the
corresponding image in a larger format with complete imaging details.
|
|
|